Set Up Your Lakehouse
- Contact our sales team
To create your own Lakehouse, please reach out to our sales team. They will assist in granting the necessary permissions to your registered user.
- Configure your cloud account
Follow our step-by-step cloud configuration guide to set up your account. This will allow the FastLake Control Plane to set up and manage all required resources in your account.
- Create a new project
Use the project creation instructions to define your project settings and initiate the resource provisioning process. This setup typically takes 30–60 minutes, depending on the configuration you select.
- Enjoy your Lakehouse
Once setup is completed, your Lakehouse will be ready for use. It’s a fully functional, end-to-end solution where you can start loading your data and implementing your business logic immediately.
Getting Started tutorial - basic
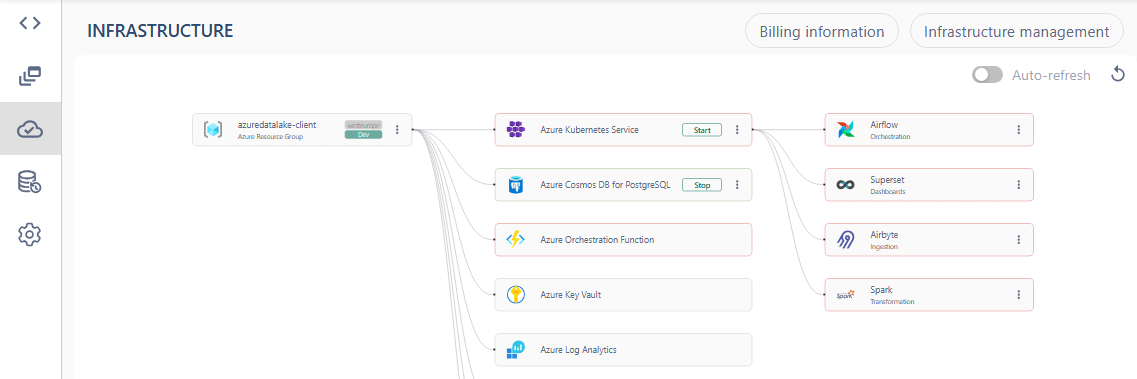
Open the project you created and verify that all services are running by checking the header.

If any services are not running, navigate to the Infrastructure page and start them.
Add data to Raw zone
You can either upload data directly to the dataset or set up a connection for automatic data synchronization. Let's take a closer look at both options.
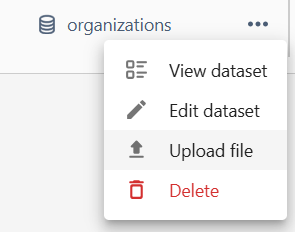
Upload the source file manually
Create new dataset in Raw zone and upload your source file

Automatically
Open the Infrastructure page and navigate to Airbyte UI


Create new connection. Define source from Airbyte's catalog of connectors or build your own custom connector.

If you can't find the required connector in the list, you will need to create a custom connector.

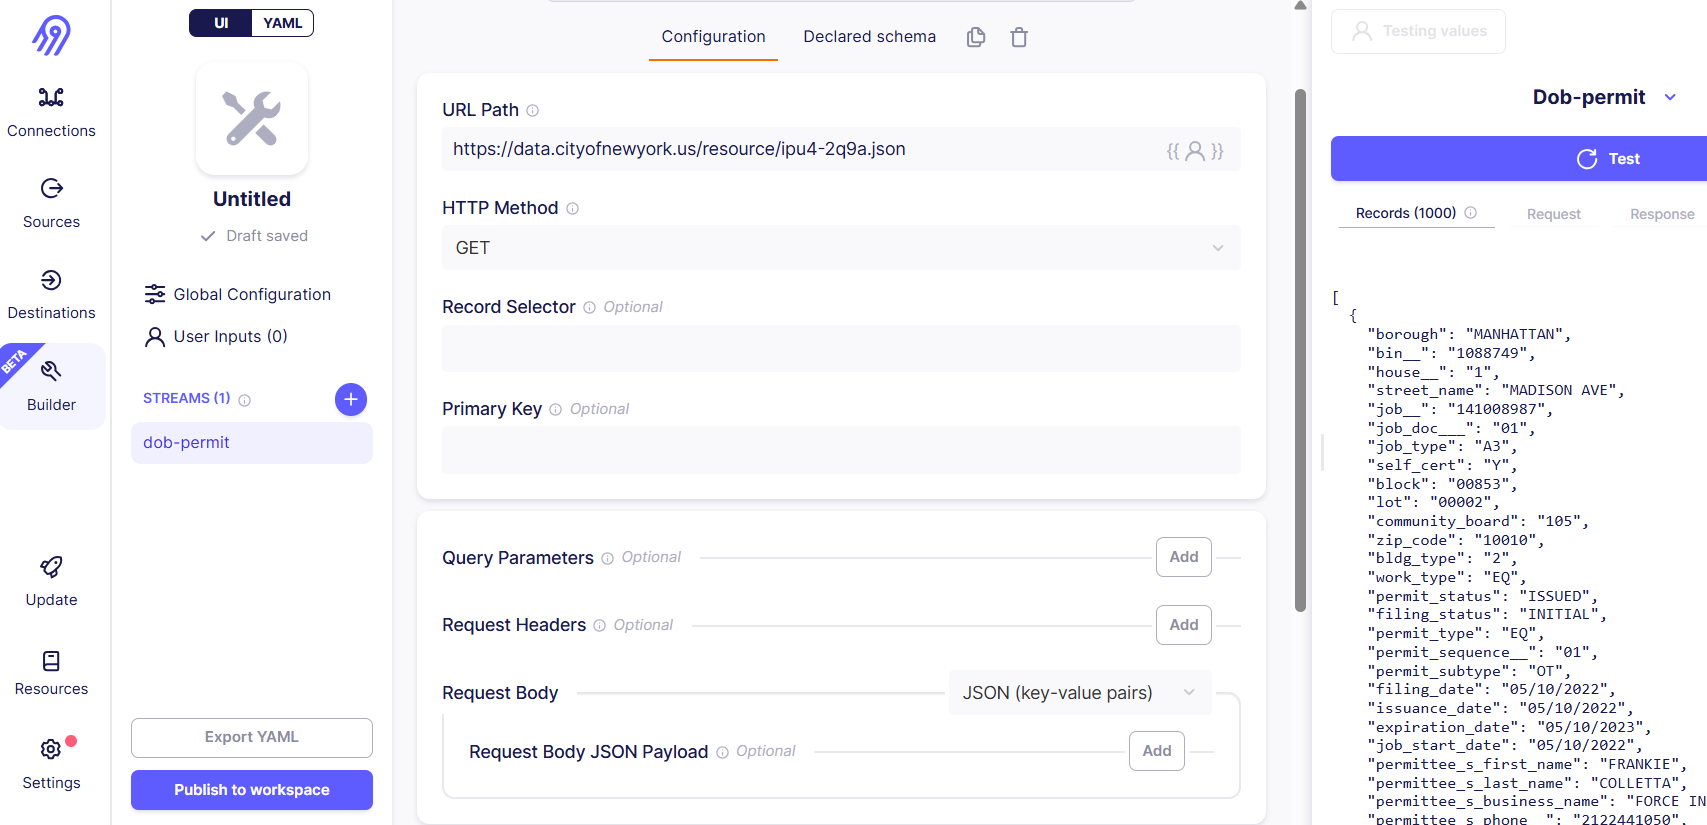
Create a new custom connector using the builder. Add a stream, and in the URL Path field, enter your source API endpoint. Test the connector, and if it works, publish it to the workspace. After that, your connector will appear in the list of all connectors. You can easily find it by applying a filter to show only custom connectors.
Define destination by choosing Azure Blob Storage connector and linking it to your Azure raw-zone-container. To find your credentials open Azure services -> Storage account. Under menu Security + networking / Access keys copy storage account name and storage account key, storage container (bucket) name for raw zone will be azuredatalake-raw. Define the output format – this will determine the format of the dataset created in the application.
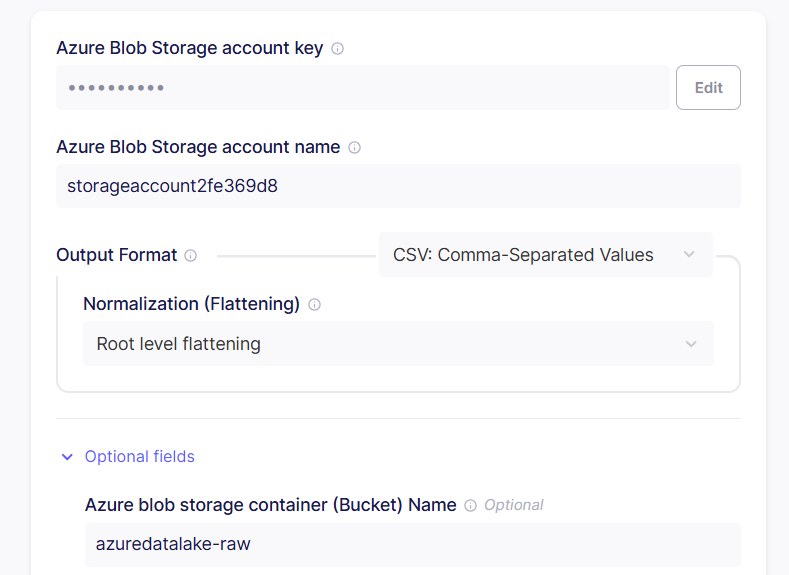
On the last step configure data sync frequency. You can choose one of the following options:
- Scheduled: Automatically replicate data at regular intervals (e.g., every 24 hours).
- Manual: Trigger data replication manually as needed.
- Cron: Use a custom cron expression to define a specific replication schedule tailored to your needs.

Airbyte will automatically create a dataset in the Raw zone and load a file with data from the specified source. Edit the dataset settings to configure headers if necessary.
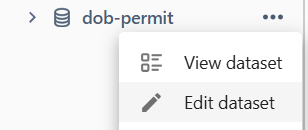
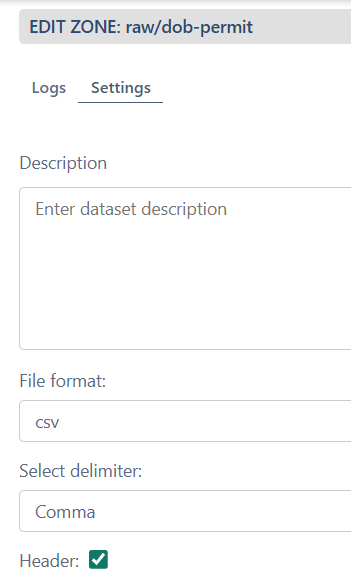
Transfer data to Clean zone
- Create new dataset in Clean zone
- Menu > Edit code
- Add a source by dragging dataset from Raw zone
- Add transformation code to clean the data (SQL or PySpark)
- Materialize and Publish
Example of SQL code:
SELECT borough, permit_status, residential, issuance_date, expiration_date, owner_s_business_type, work_type,
  CASE
    WHEN job_type = 'NB' THEN 'New Building'
    WHEN job_type = 'A1' THEN 'Alteration Type 1'
    WHEN job_type = 'A2' THEN 'Alteration Type 2'
    WHEN job_type = 'A3' THEN 'Alteration Type 3'
    WHEN job_type = 'SG' THEN 'Sign'
    WHEN job_type = 'DM' THEN 'Demolition'
    ELSE 'Other'
  END AS job_type
FROM df_dobpermit
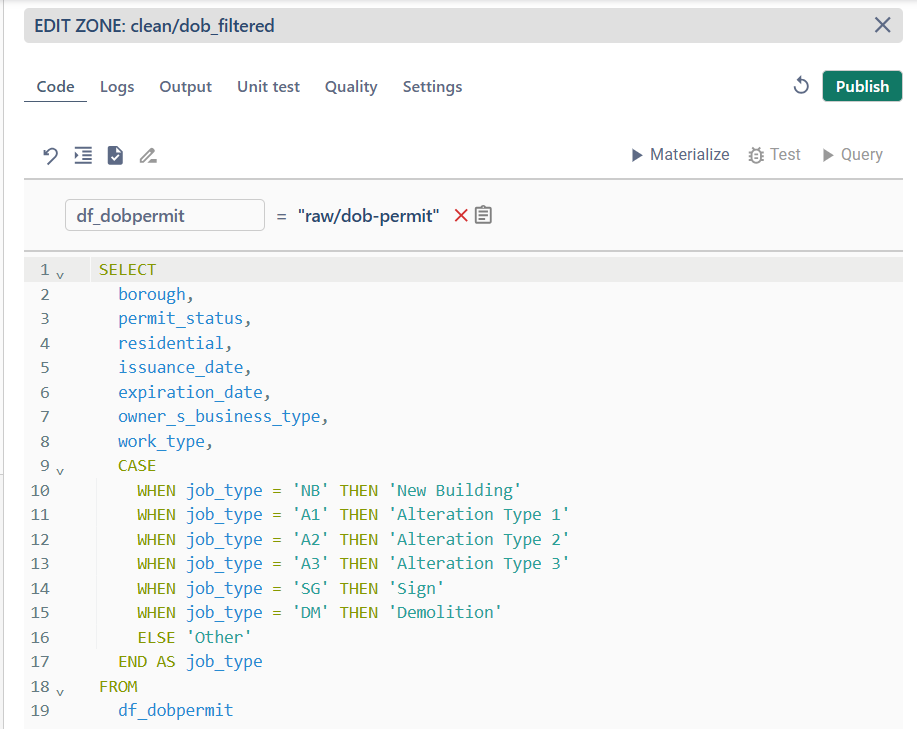
Example of PySpark code:
result = df_organizations.select("Name", "Website", "Country", "Description", "Founded", "Industry", "Number of employees").withColumnRenamed("Number of employees", "Number_of_employees")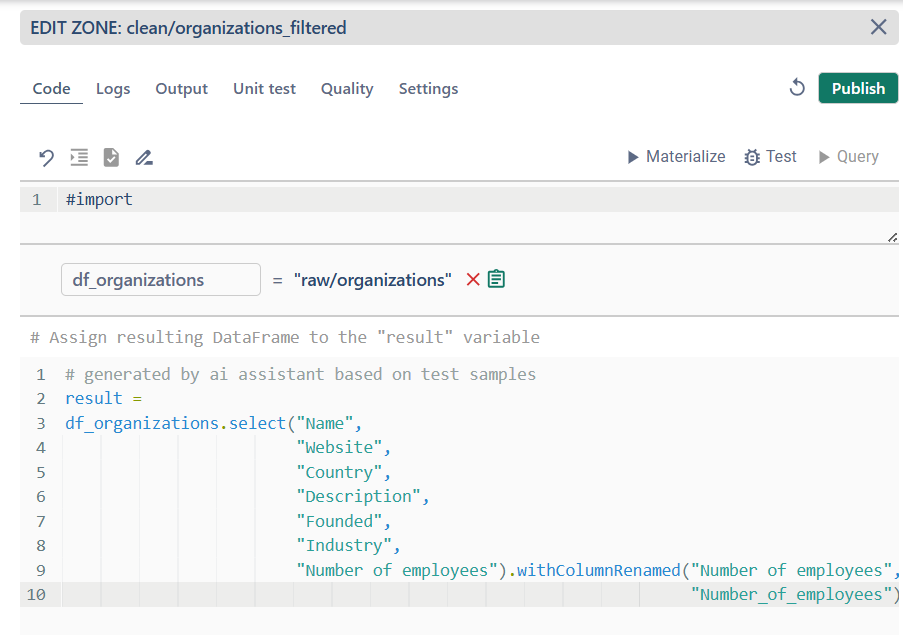
Create Superset dashboard
- Open Infrastructure page and navigate to Superset UI
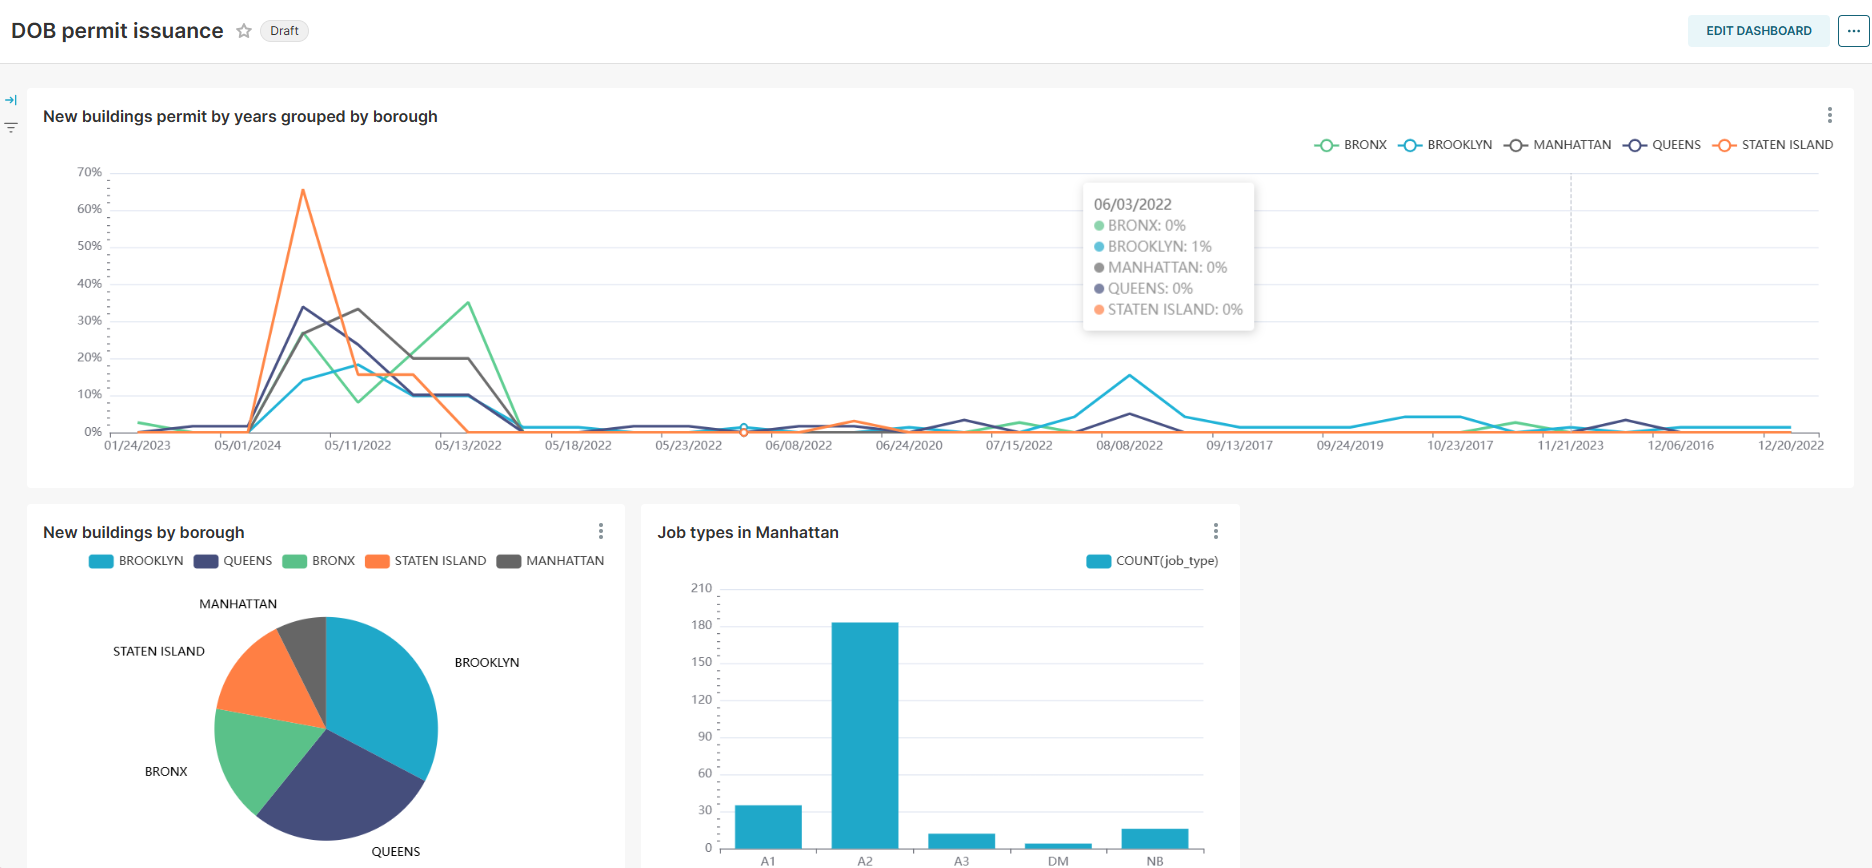
- Create a dashboard and add new charts to visualize your data

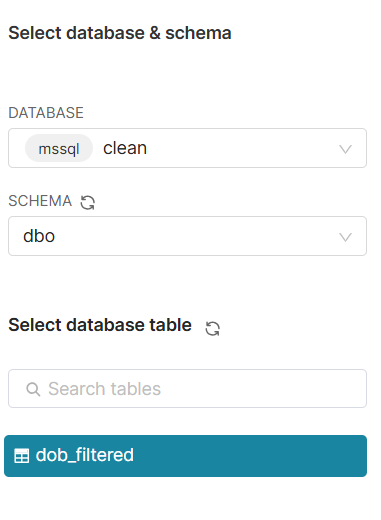
For the first time you have to Add a dataset. Select database zone and dbo schema. Choose dataset from list of tables.
Create new charts based on source data and add it to Dashboard
Getting Started tutorial - advanced
Create dataset in Transform zone
- Create new dataset in Transform zone
- Menu > Edit code
- Open Settings tab and set language, job size and file format.
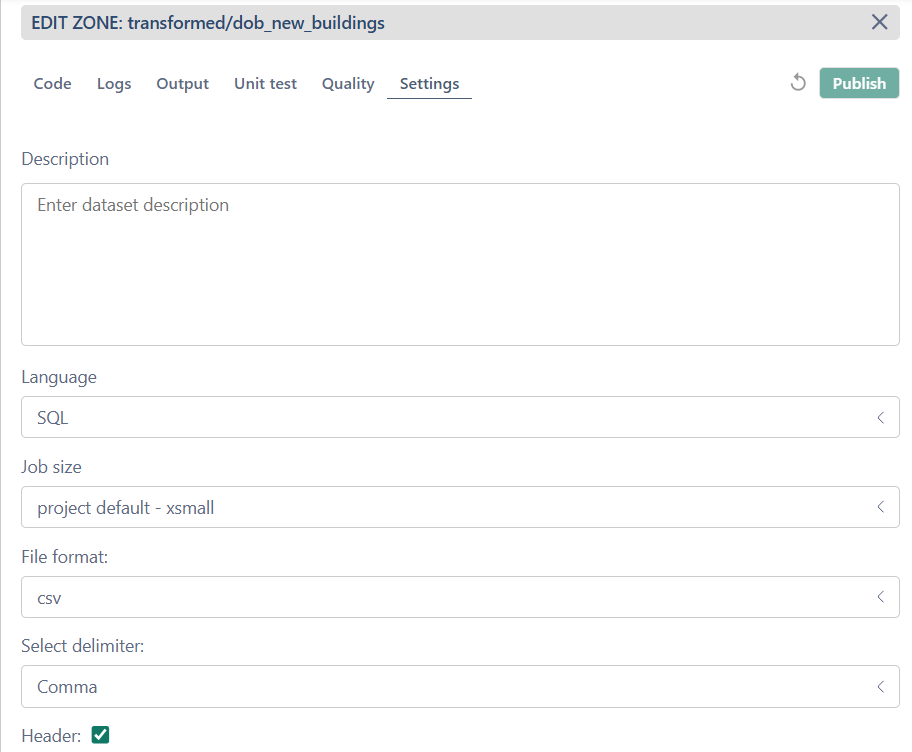
- Under Code tab write SQL code for data transformation. You can check for syntax errors by clicking the check icon. Any errors will be highlighted.

- Fix the code and format it by clicking the Format icon.
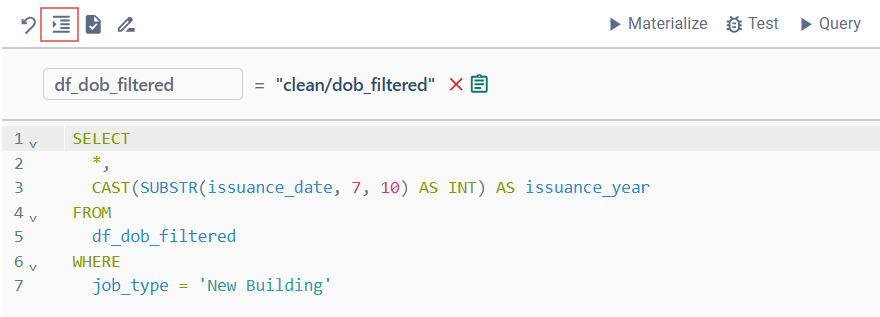
- Run "Query" to preview the result under Output tab.
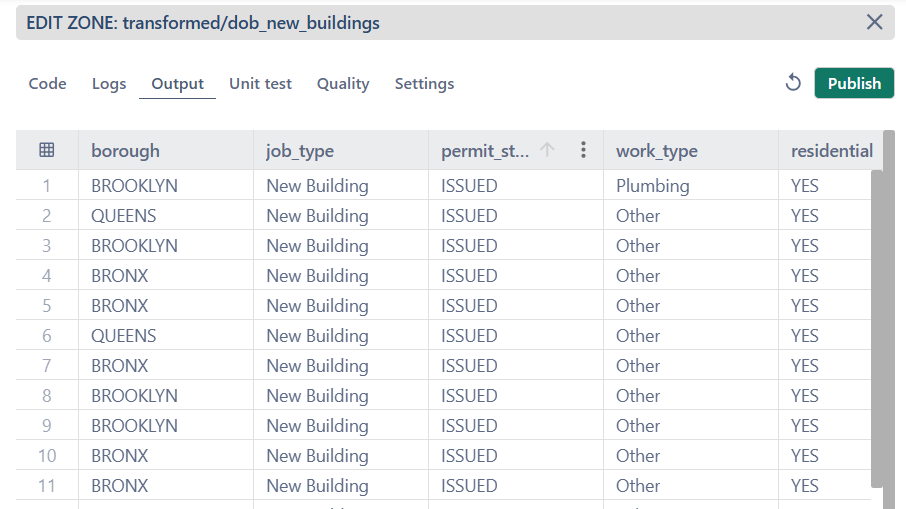
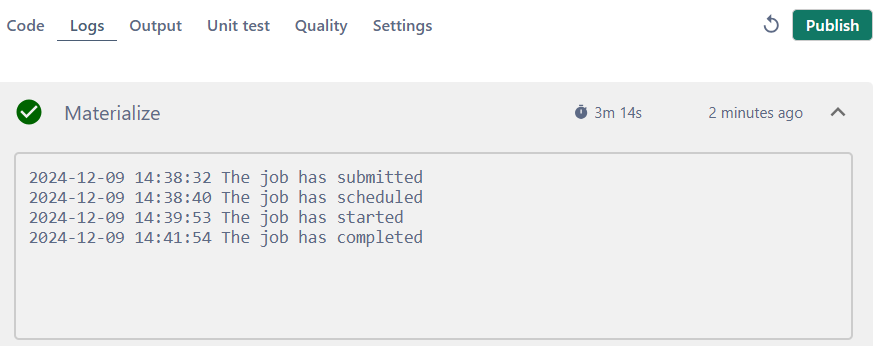
- If the result meets the expected outcome, proceed with materialization.
- If you want to ensure that the transformation code works correctly, you can upload test samples. These are files with the same structure as the source and target datasets but containing a limited number of rows. Refer to the tips for the correct file format.
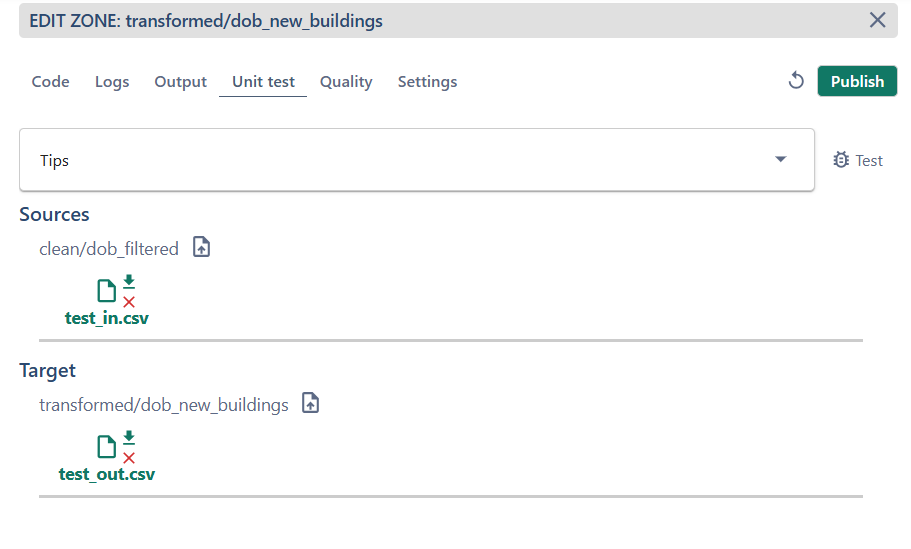
- Based on the test samples, the transformation code can be generated automatically by clicking the Generate button.

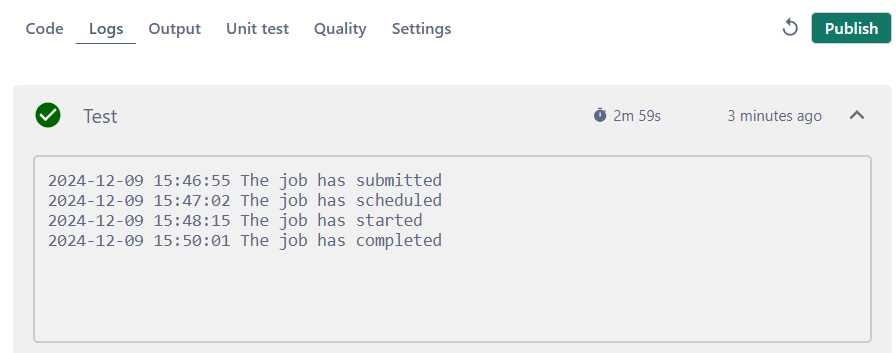
10. Run unit test to make sure that data transformation works correctly as expected
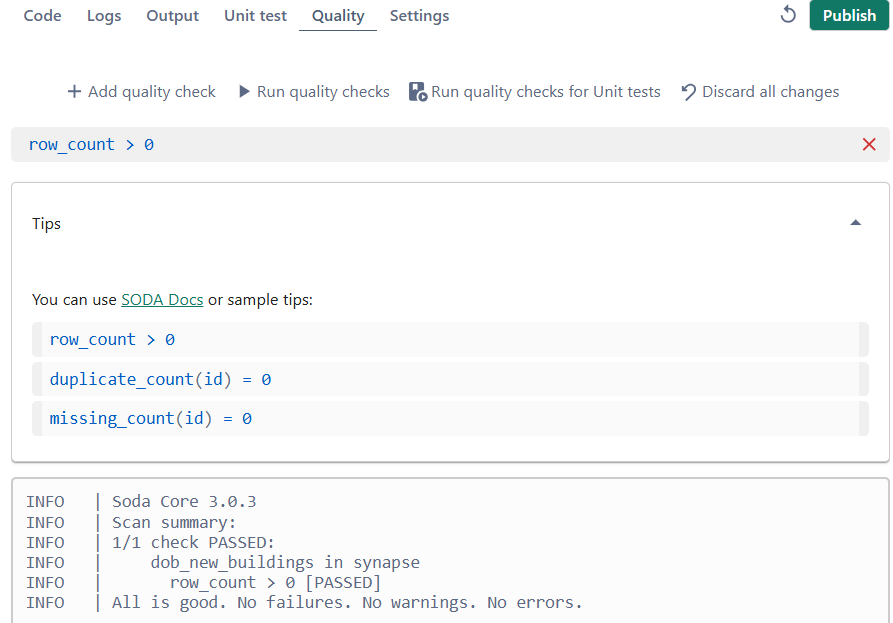
11. To ensure the data meets the required quality standards, add and run quality checks.
12. Publish changes.
Additional Features for Working with Data
You may create more datasets in Transform zone using the same source.
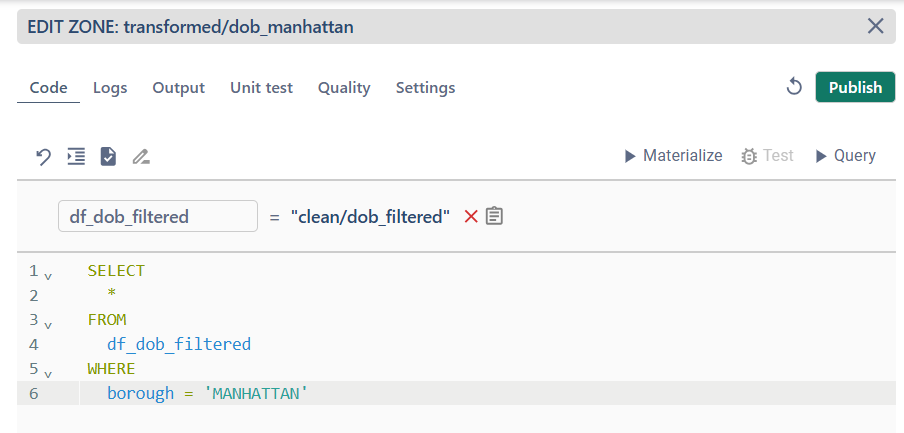
You can also add multiple source files and aggregate the data in transformation code.
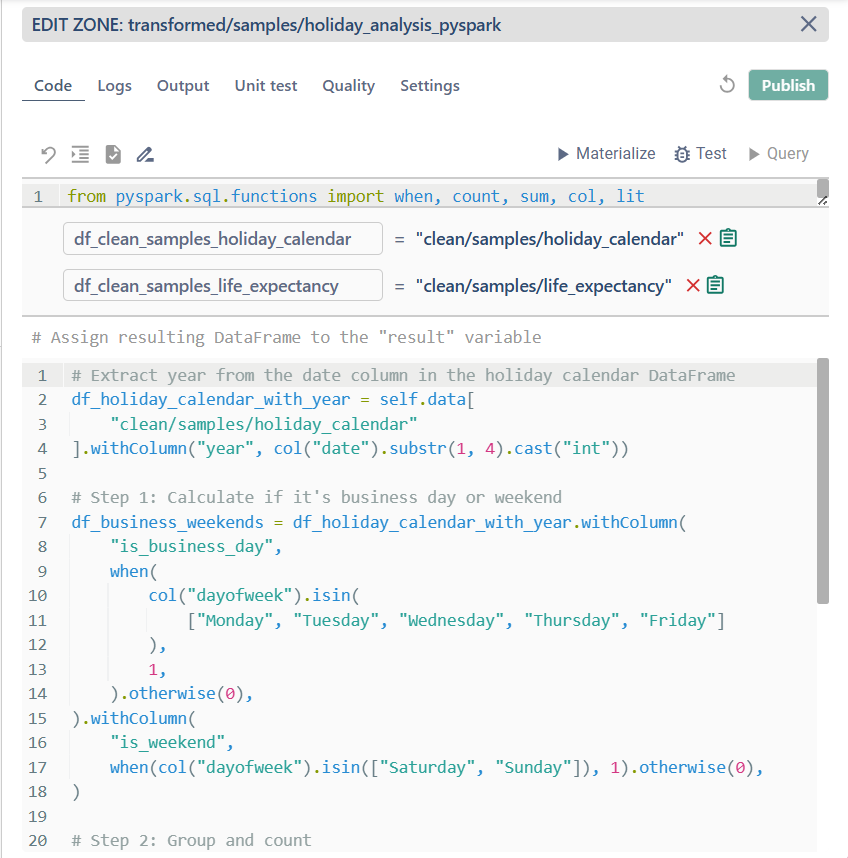
Example of PySpark code:
# Extract year from the date column in the holiday calendar DataFramedf_holiday_calendar_with_year = self.data[ "clean/samples/holiday_calendar"].withColumn("year", col("date").substr(1, 4).cast("int"))# Step 1: Calculate if it's business day or weekenddf_business_weekends = df_holiday_calendar_with_year.withColumn( "is_business_day", when( col("dayofweek").isin( ["Monday", "Tuesday", "Wednesday", "Thursday", "Friday"] ), 1, ).otherwise(0),).withColumn( "is_weekend", when(col("dayofweek").isin(["Saturday", "Sunday"]), 1).otherwise(0),)# Step 2: Group and countdf_grouped = df_business_weekends.groupBy( "country", "countrycode", "year", "type").agg( count(lit(1)).alias("count_all"), sum("is_business_day").alias("count_business_days"), sum("is_weekend").alias("count_weekends"),)# Step 3: Join with life expectancy based on both country and yeardf_joined = df_grouped.join( df_clean_samples_life_expectancy, on=["country", "year"], how="inner",)# Step 4: Select and formatresult = df_joined.select( "country", "countrycode", "year", "type", "count_all", "count_business_days", "count_weekends", "life_expectancy",)
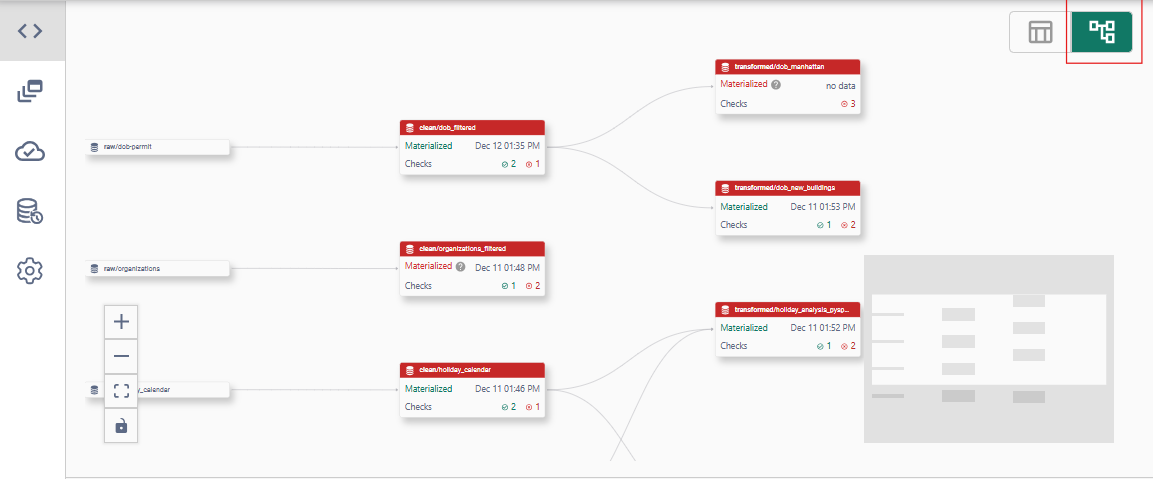
When switching to the DAG view, dependencies between datasets are displayed, with lines indicating which dataset serves as the data source for another.
Remember that you can use the AI Explorer to quickly find the required dataset or generate an SQL query for data transformation.

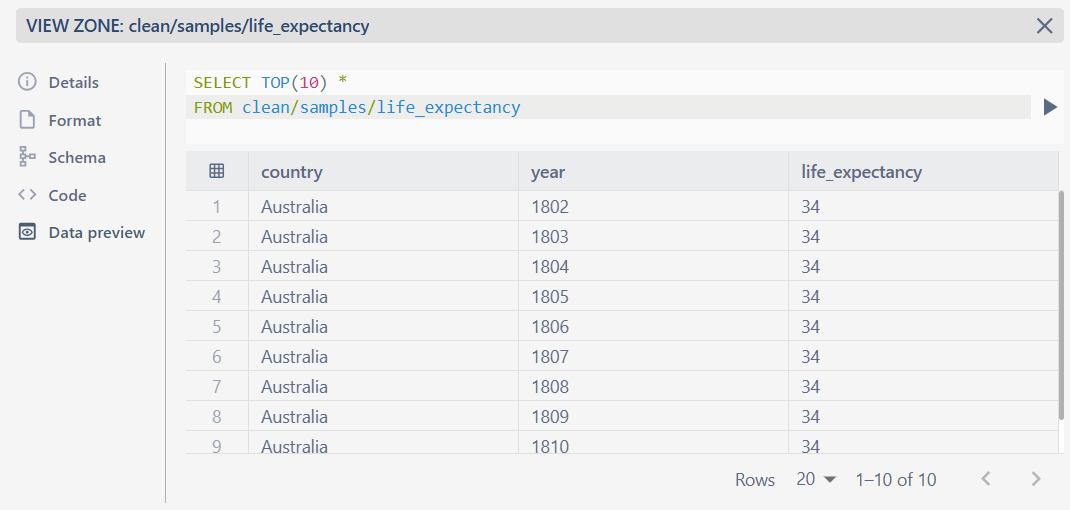
You can preview the dataset by clicking the menu on a dataset and selecting View Dataset. Under the Schema tab, you'll find the table schema, while the Data Preview tab allows you to query data from the dataset. This feature can be used to generate useful data.

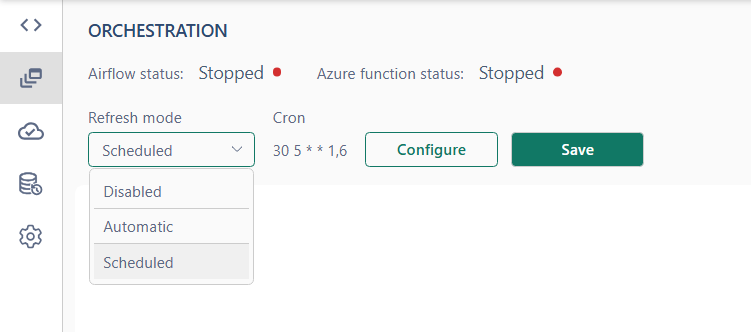
Configure daily scheduling
Automatic orchestration allows you to run jobs on a schedule. To reed more follow the link.
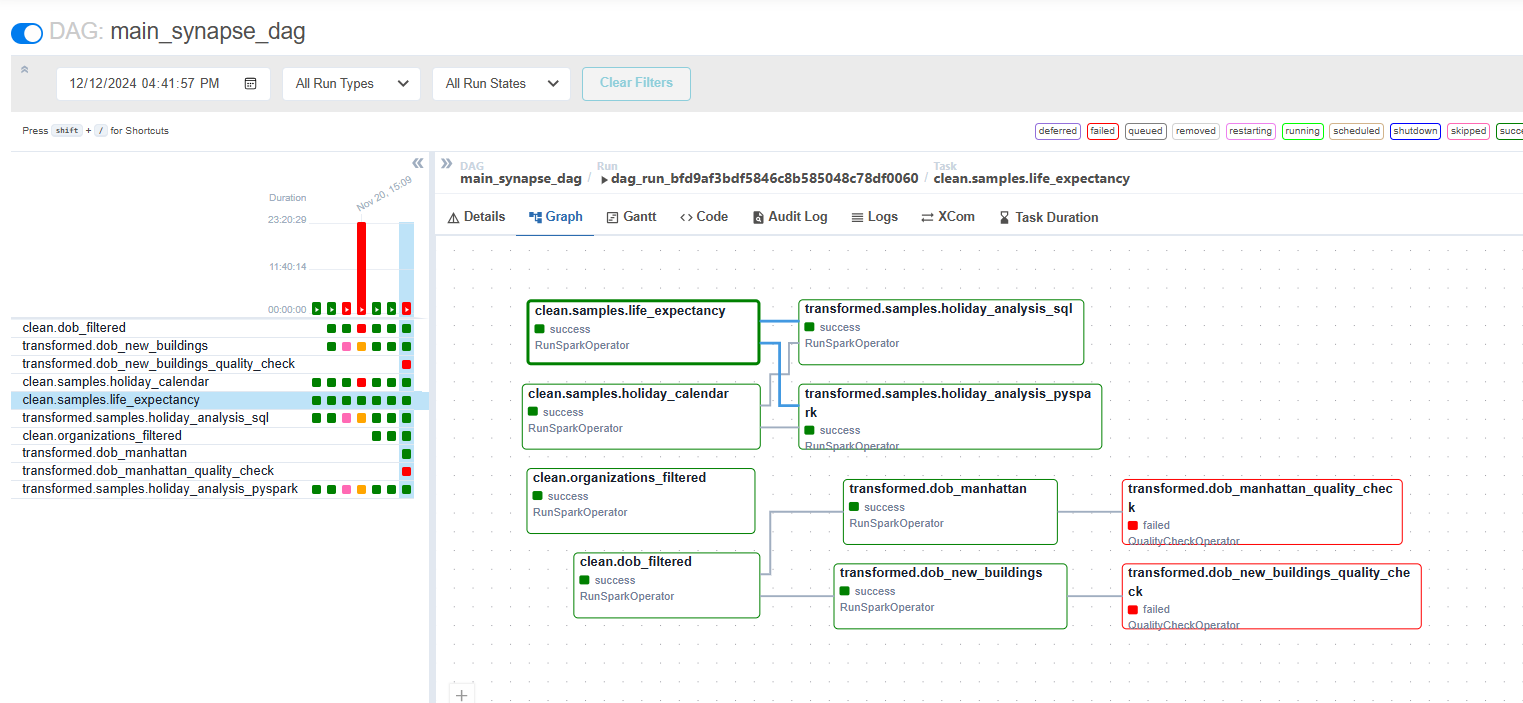
Open Airflow UI to see generated DAG.
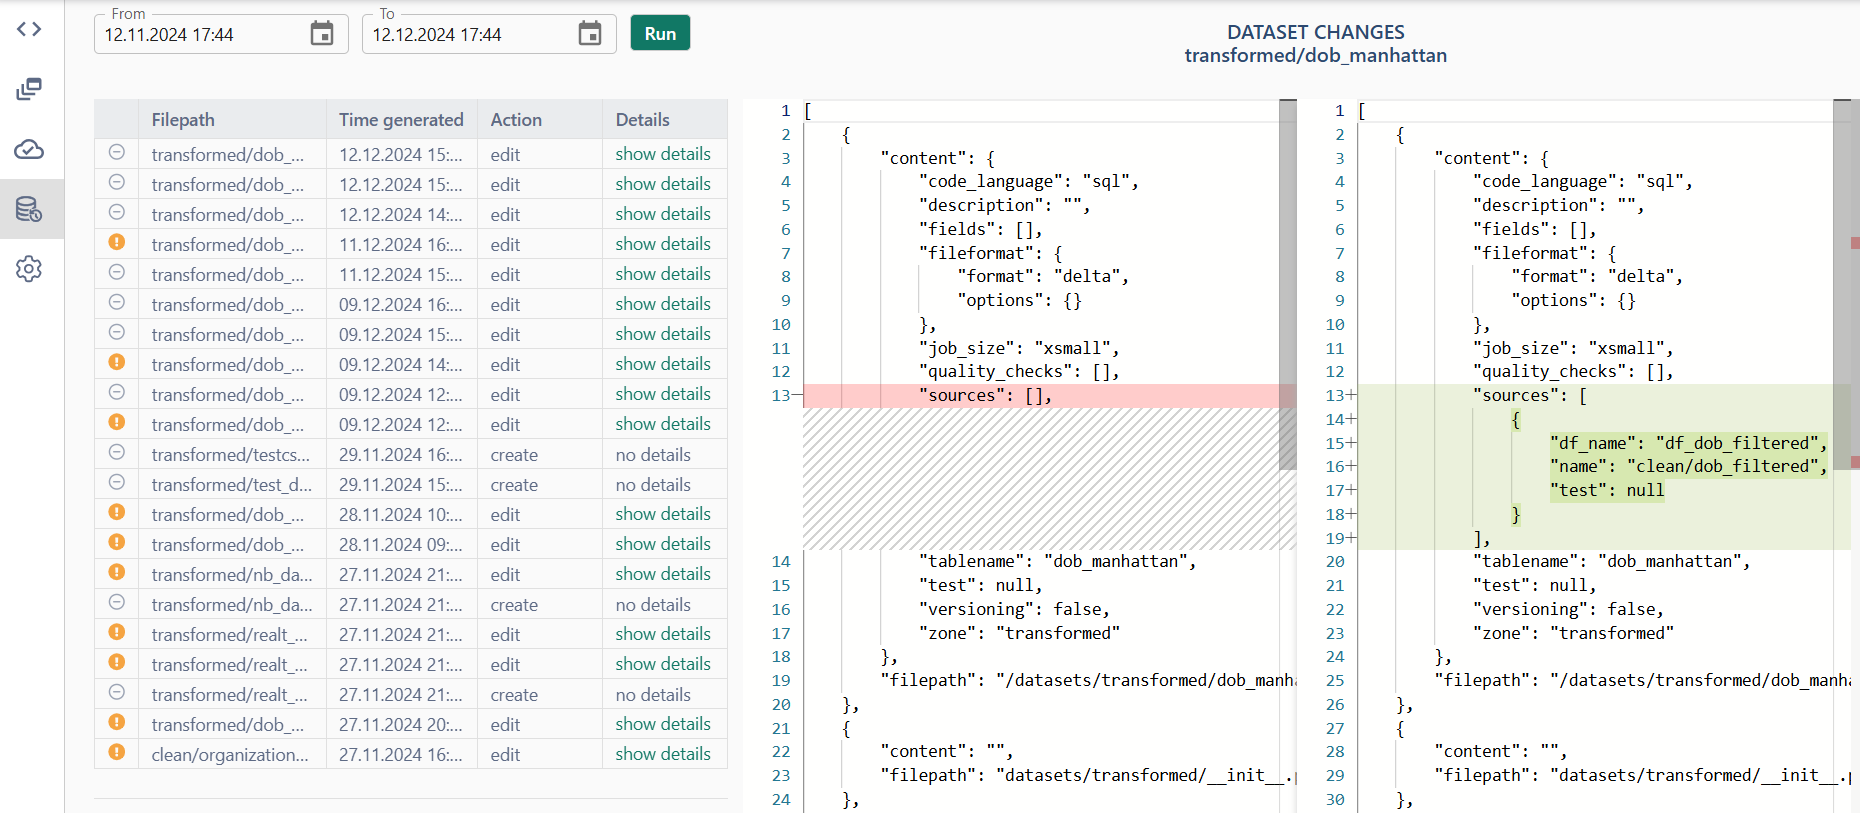
Dataset history
The Dataset history page helps track all changes made to datasets during a specified period of time. Including displaying detailed descriptions of changes.
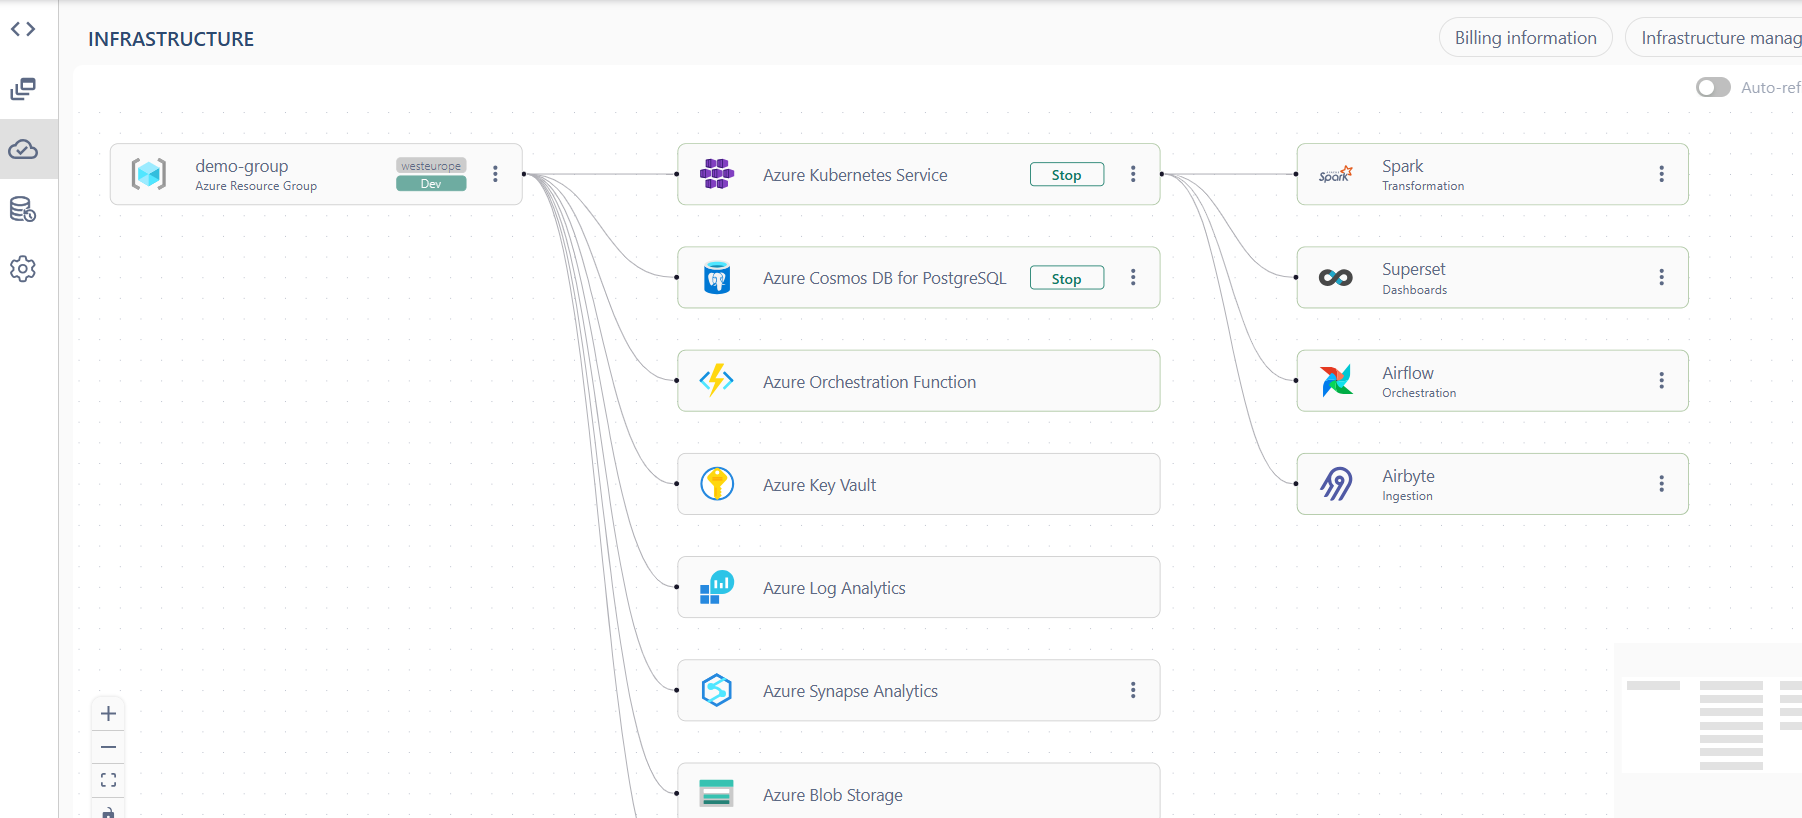
Infrastructure
As we mentioned above all services must be running for the application to work correctly.
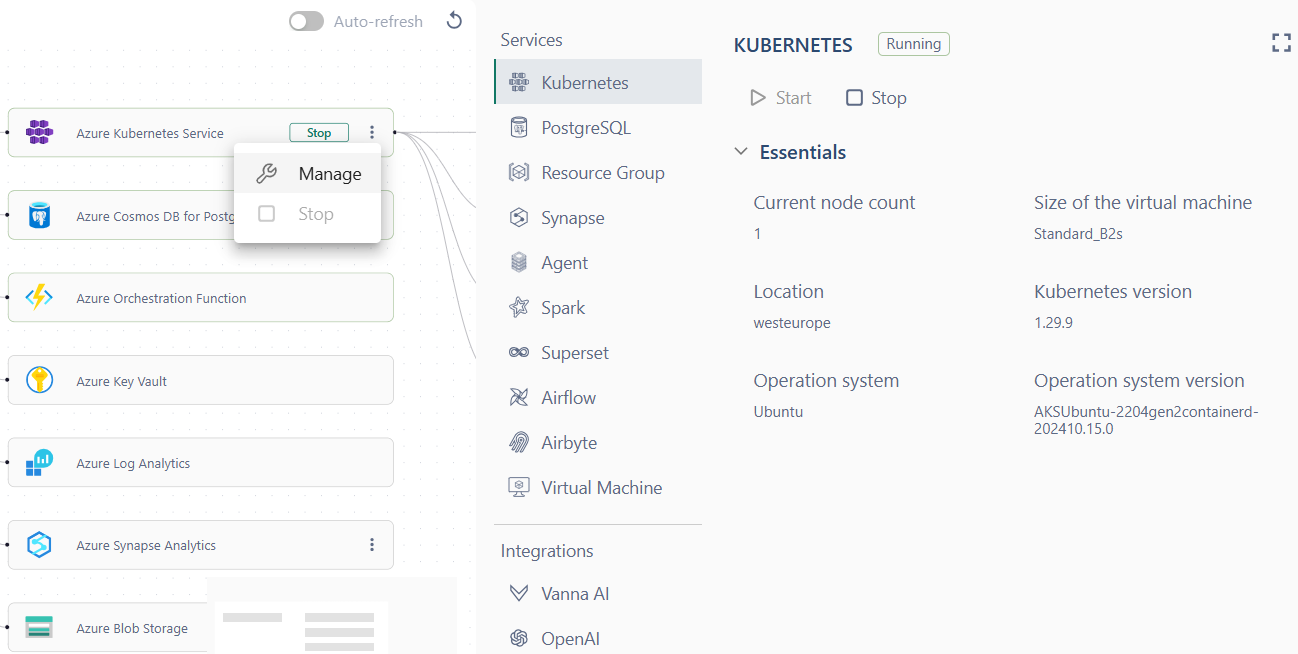
To manage the services, open the Infrastructure management tab.
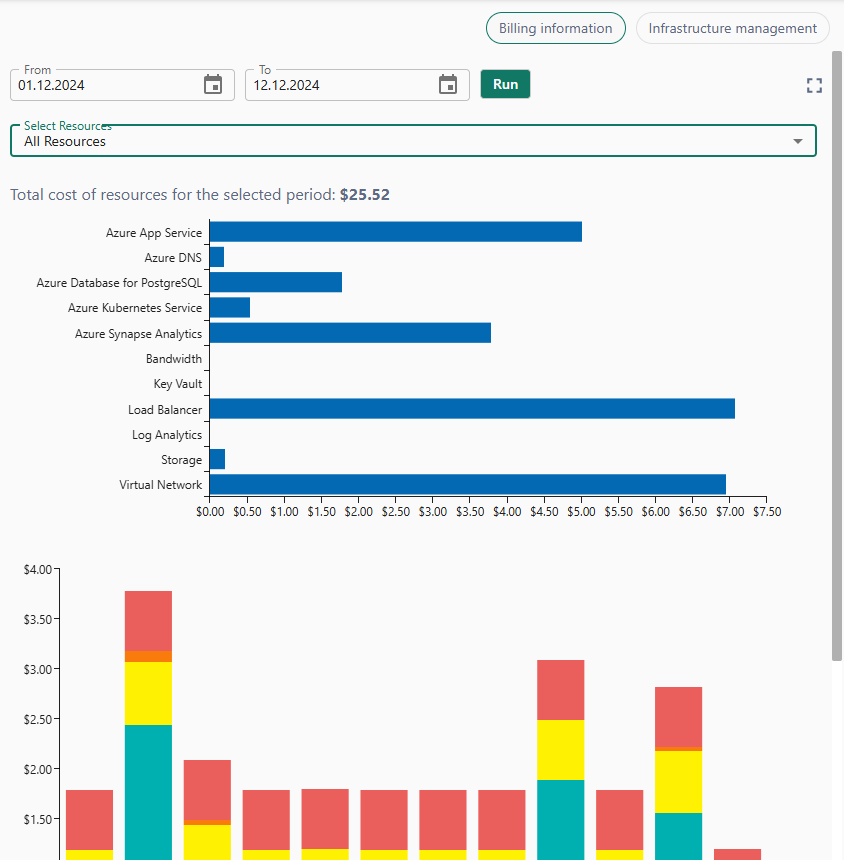
Billing information tab provides information on resources costs, builds graphs based on specified filters and time period
Job size adjustment
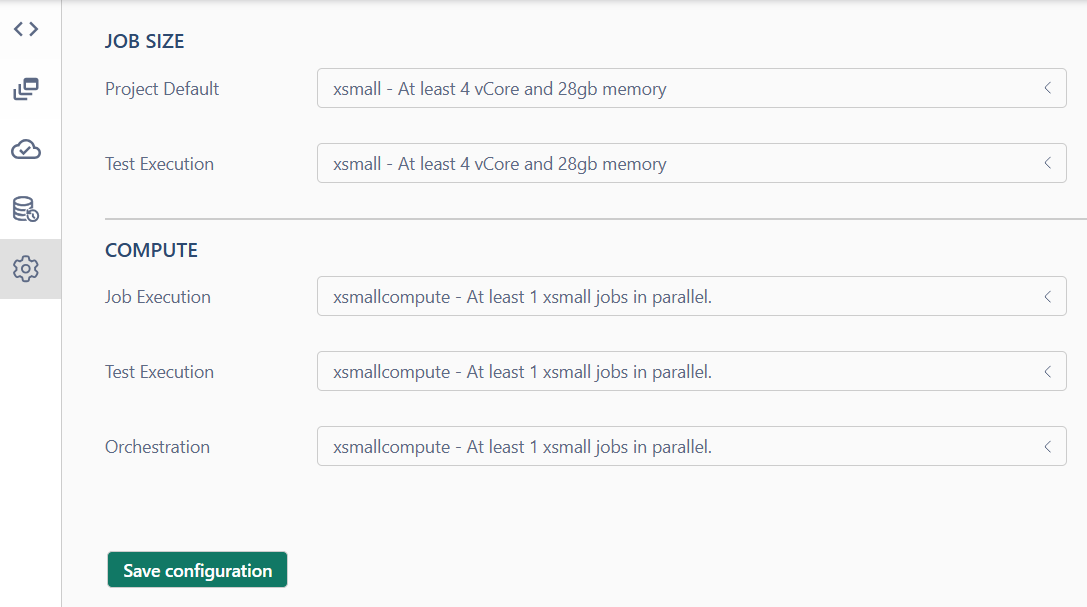
Go to the Settings page to allocate resources for each type of jobs.
