Read-only Demo project
All registered users get read-only access to our demo project with pre-created resources. You can explore all the major features in interactive way and get familiar with the platform.
Simply register using your email or use Microsoft or Google authentication. Once logged in you will be assigned with the Guest role on all access management levels of the Demo project.
You won't have permissions to modify or run jobs but will be able to explore most of UI components.
Code Editor page
The Code Editor page is the main interface for working with data.

It is divided into three logical sections:
- Datasets Area (Raw, Clean, and Transform)

This section displays datasets organized into three categories:
- Raw: original unprocessed datasets
- Clean: preprocessed datasets ready for analysis
- Transform: datasets generated from transformations
- View zone

Displays detailed information about the selected dataset, including:
- Details: general metadata about the dataset
- Format: the file type
- Schema: the column names, data types, and other schema details
- Code: the code logic used to transform the dataset
- Data Preview: displays the requested data from the dataset for review
- Edit zone

Provides a code editor for data transformations. Here, you can view and modify the transformation code and query results to check the output
- Code: access and edit the transformation logic applied to a dataset
- Logs: job logs shows here
- Output: shows result after query the code
- Unit test: to test the transformation code on sample data
- Quality: to verify the results of materialized or tested data
- Settings: to set up dataset settings and change code language
We have implemented AI data explorer to help you quickly locate data and automate dataset creation. (Refer to the documentation for details.)

Orchestration Page
The Orchestration page allows you to manage and monitor the execution of workflows and data pipelines.

Infrastructure Page
The Infrastructure Page provides a comprehensive overview of the services deployed. It is visually represented as a dependency map, allowing you to understand the relationships between various components and their status.

Navigation Options:
- Infrastructure Management: you can open the infrastructure management panel to get detailed information about a specific service, including configuration details, credentials and link to UI for further interaction or management.
- Billing Information: you can view detailed billing data for the services over a defined period. This helps track costs associated with each service or group of services.
Dataset History Page
The Dataset History page provides a detailed record of all changes made to datasets over a specified time period. This allows you to track and review the dataset's evolution and ensure data integrity.

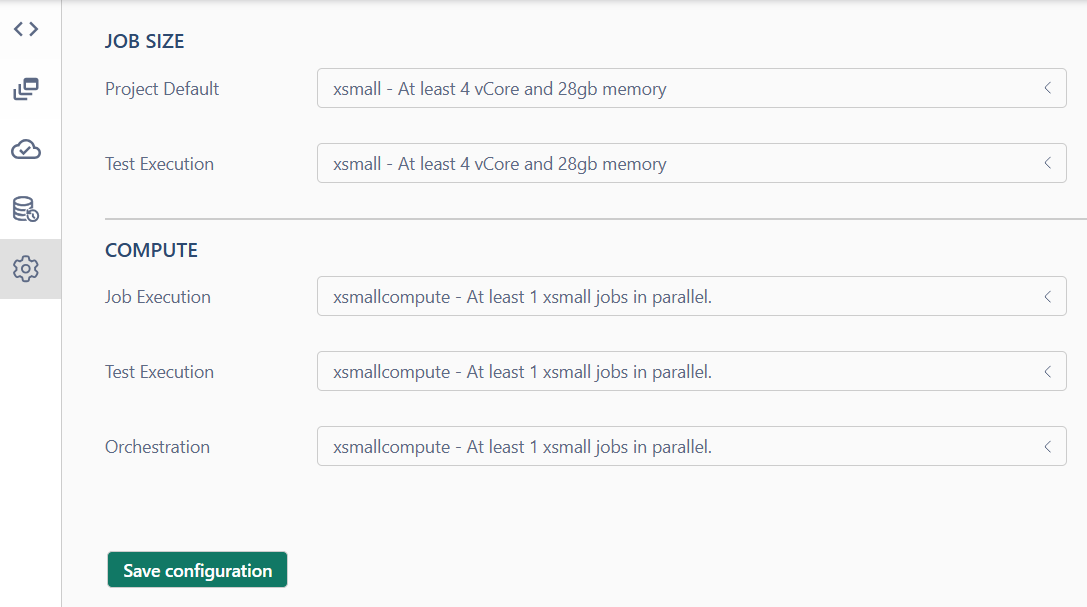
Settings Page
The Settings Page allows you to configure resource allocation and compute settings for various jobs and workflows.


